
| NB: When considering information concerning groups of people with ME/CFS and those with long COVID, it is important to remember that ME/CFS is a symptom-based clinical diagnosis not a mechanistic one. It is clear there is a high degree of shared pathophysiology between ME/CFS and long COVID, and the two diagnostic labels are not mutually exclusive. Importantly, some individuals with long COVID meet ME/CFS diagnostic criteria or could have a dual diagnosis. |
Key points
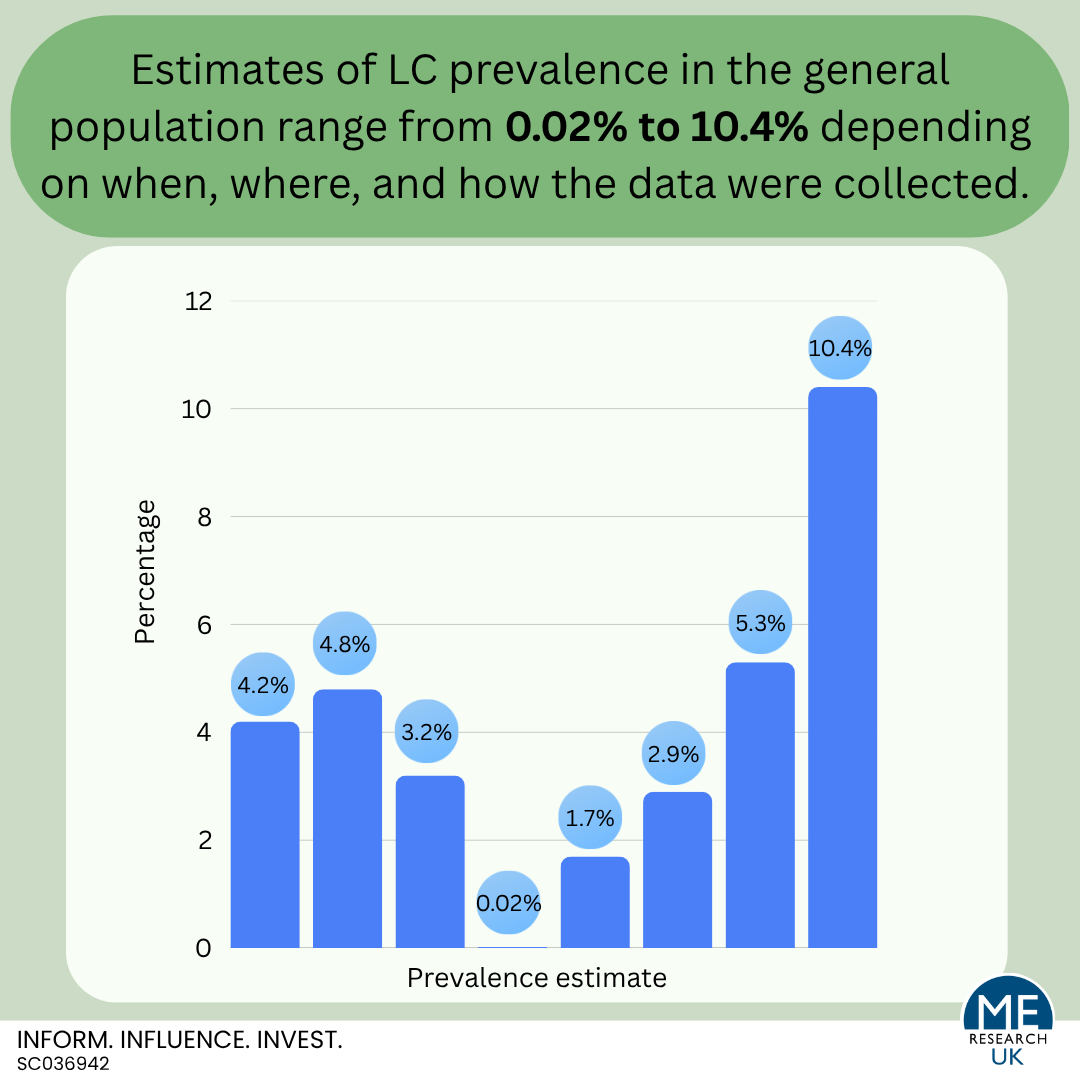
- The proportion of people with LC in the general population remains unclear.
- Self-reported rates of LC in the general population range from 2.9% to 10.4% depending on when and where the research was carried out.
- Estimates based on information in medical records from Scotland range from 0.02% to 1.7%, and vary depending on the measure used (i.e., clinical codes, free text or sick notes).
- It may not be appropriate to extrapolate or directly compare estimates from different regions or countries due to variation in population structure related to factors such as age, sex and ethnicity, but also factors relating to COVID-19 such as COVID-19 variant, vaccination status and reinfection rate.
Introduction
While the previous article considered the research relating to the prevalence of long COVID (LC) amongst those who had a COVID-19 infection, this section looks at the evidence on the prevalence of LC in the general population. Again, this is not a review of all available evidence, rather consideration of the most recent population-level survey data for England, Scotland, the UK as a whole and the USA.
England
In 2021, the GP Patient survey – an independent survey sent out to over two million people registered with GP practices in England – was modified to include the question “would you describe yourself as having ‘LC’? That is, you are still experiencing symptoms more than 12 weeks after you first had COVID-19 that are not explained by something else.” In 2025, 4.2% of the population reported that they would describe themselves as having LC.
| Would you describe yourself as having ‘LC’? | ||||
| Yes | No | I don’t know | I would prefer not to say | |
| 2022 | 4.4% | 87.3% | 7.3% | 1.0% |
| 2023 | 5.0% | 84.6% | 9.5% | 1.0% |
| 2024 | 4.6% | 84.8% | 9.4% | 1.2% |
| 2025 | 4.2% | 85.0% | 9.5% | 1.3% |
Although this survey is based on self-reported data, and does not include everyone in England, it gives an indication of the proportion of those over the age of 16 who are living with LC since 2022. Notably the data suggests that the prevalence rate is relatively stable, although there was a slight peak in 2023.
Also worth considering is a study, published in February 2025, which looked at a subset of the 2023 GP Patient survey data in more detail. Results showed that the prevalence of LC in the sample of 759,149 people they analysed was 4.8%. Here, LC prevalence was found to be higher in:
- Those aged between 35 and 54 years,
- Females,
- Those who self-identified as ‘White Gypsy/Irish Traveller’ or ‘mixed/multiple ethnic groups’,
- Those who were gay/lesbian or bisexual,
- People living in deprived areas,
- Parents or carers,
- In those with a long-term health condition.
Based on these findings, the research team concluded that there was an unequal distribution of LC in England, with higher prevalence rates identified for disadvantaged and minoritised groups.
This paper also considered the characteristics of those who were uncertain whether or not they had LC. The results identified that those aged 25 years or under, males, non-binary, heterosexual, not parents or carers, from other White, Indian, Bangladeshi, Chinese, Black or Arab backgrounds, former and current smokers, and with no defined long-term condition were more likely to be unsure about having LC compared to answering ‘yes’. This may be because they are not aware of the symptoms of LC, have ongoing symptoms but are not sure whether they relate to a COVID-19 infection, or are experiencing symptoms but are not sure whether they would describe themselves as having LC. Either way, the numbers of those who were ‘uncertain’ may skew prevalence estimates.
Scotland
A paper from the Scottish Government entitled “Investigating the prevalence of long COVID in Scotland”, stated that estimates of self-reported LC prevalence for March 2024 (published by the ONS using information from the Winter COVID-19 Infection Study) indicated that 3.2% of people living in private households in Scotland had the illness. Similarly to rates in England, earlier ONS data for Scotland in 2023 indicated that LC prevalence was higher for those aged 50 to 69, those living in the most deprived area, and for those whose daily activity is limited by pre-existing health conditions.
There is also a study in Scotland, published in 2024, which estimated the prevalence of LC using medical records between March 1, 2020, and October 26, 2022 for 4,676,390 people 18 years and over. Findings suggested that “The prevalence of long COVID presenting in general practice was estimated to be 0.02–1.7%, depending on the measure used.” Notably, clinical codes identified fewest cases (1,092, 0.02%), followed by free text (8,368, 0.2%), sick notes (14,469, 0.3%), and what was termed an ‘operational definition’ based on patterns of clinical interactions recorded in the electronic health records (64,193, 1.4%). Overall, 1.7% of the sample were identified as having LC using one or more method of identification. The research team states that this study used data for “virtually the entire adult population of Scotland”, and conclude that their results “likely underestimates the true prevalence, given incomplete health-seeking behaviour by patients, and under-recording of symptoms and long COVID diagnoses in primary care. In addition, among individuals with existing health conditions, it is possible that the operational definition overestimated the number of patients with long COVID.”
Another study considered the prevalence of ongoing self-reported symptoms attributable to a SARS-CoV-2 infection in 198,096 adults from across Scotland (what the authors refer to as a nationwide population cohort study). Importantly, the methods used in this study aimed to account for “symptoms that would have occurred anyway” – i.e., symptoms that would have been experienced independent of whether or not someone had a COVID-19 infection. Within the cohort, 49.8% had a laboratory-confirmed SARS-CoV-2 infection, and the remaining 50.2% were never infected and matched on age, sex, and socio-economic status. There were 64.5% of those who had a confirmed COVID infection who reported at least one ongoing symptom 6 months following infection, but, interestingly, this was also true for 50.8% of those who were never infected. Once the research team had controlled for factors that could have influenced prevalence – including age, sex, vaccination status, number of long term conditions, and COVID-variant – the prevalence of persistent symptoms at 6, 12, and 18 months following infection was 6.6%, 6.5%, and 10.4%, respectively. The authors of this paper recognise that those who tested positive for COVID-19 may represent those who had more severe symptoms in the acute phase of infection, as unlike those with asymptomatic or mild COVID-19 symptoms, those with a more severe infection would have been more likely to be tested, and this may have led to an overestimation of LC prevalence. Additionally, significant numbers of participants dropped out over the follow-up of the study. It is possible that had all participants stayed in the study, observed prevalence rates may have been different.
United Kingdom
Results based on 269,971 responses to the Coronavirus (COVID-19) Infection Survey (CIS), a major UK study run by the Office for National Statistics (ONS) that measured the prevalence and spread of COVID-19 in the community, collected over the four-week period ending 5 March 2023, show that an estimated 1.9 million people living in private households in the UK – 2.9% of the population – were experiencing self-reported LC. Here, LC was defined as ‘symptoms continuing for more than four weeks after the first confirmed or suspected coronavirus (COVID-19) infection that were not explained by something else’.
The main limitation of these data is that LC status was self-reported by study participants, meaning that misclassification is possible and the prevalence rate may not accurately reflect the number of people with LC in the population. As noted by the ONS, in this instance misclassification means that “some participants may be experiencing symptoms because of a health condition unrelated to COVID-19 infection. Others who do have symptoms caused by COVID-19 may not describe themselves as experiencing LC”. Additionally, the definition of LC used is not consistent with that specified in the NICE guidance (last updated Jan 2024) for identification of LC which is: ‘signs and symptoms that develop during or after an infection consistent with COVID‑19, continue for more than 12 weeks and are not explained by an alternative diagnosis’. It is also worth noting that not all sampled households invited to participate in the study took part, and some individuals dropped out over time. If those who did not take part, or who dropped out, were systematically different to those who did complete the survey, the findings are likely to be biased, and as such may not accurately resent the general population. It is also possible that those with LC were not well enough to respond to this survey.
USA
Results from the Household Pulse Survey indicate that approximately 5.3% of all adults aged 18 years or over in the US were experiencing LC in October 2023. In the survey, participants were asked to answer yes or no to the following question, “Did you have any symptoms lasting 3 months or longer that you did not have prior to having coronavirus or COVID-19?” Additional information was provided explaining that “Long term symptoms may include: Tiredness or fatigue, difficulty thinking, concentrating, forgetfulness, or memory problems (sometimes referred to as “brain fog”), difficulty breathing or shortness of breath, joint or muscle pain, fast-beating or pounding heart (also known as heart palpitations), chest pain, dizziness on standing, menstrual changes, changes to taste/smell, or inability to exercise.”
Notably, in the UK there was a response option for ‘unsure’ whereas in the USA, possible responses were yes or no, meaning that, in addition to differences in population, the questions used to obtain the prevalence estimates are not comparable.
Summary
The proportion of people with LC in the general population remains unclear. Self-reported rates of LC in the general population range from 2.9% to 10.4% depending on when and where the research was carried out. Estimates based on information in medical records range from 0.02% to 1.7%, and vary depending on the measure used (i.e., clinical codes, free text or sick notes).
It may not be appropriate to extrapolate or directly compare estimates from different regions or countries due to variation in population structure related to factors such as age, sex and ethnicity, but also factors relating to COVID-19 such as COVID-19 variant, vaccination status and reinfection rate.
What proportion of people with long COVID meet ME/CFS diagnostic criteria?
